|
Script:
RTTdpCoppock
This script is a variation of RTTcCoopock, amended by markers that show where the WMA line changes direction down or up. Once a direction change has been detected, the line colour changes to amber ("Wait Colour"). A special parameter, "Precision", determines how far the line needs to move in the new direction before it is deemed confirmed. After the required distance, the colour changes to green (rise) or red (fall).
 Back to Catalogue Back to Catalogue
Purpose:
Edwin Coppock developed the Coppock Indicator with one sole purpose: to identify the commencement of bull markets. The indicator was devised for use on the Dow Jones Industrial Average but is suitable for use on other market indices or averages. When the indicator was published in Barron’s (1962), it was intended to generate buy signals in the S&P 500 only, and the suggested signal was an upturn in the Coppock Curve from an extreme low
Although often late, the Coppock Indicator has produced very reliable signals in the past.
A long-term price momentum indicator, it is used primarily to recognize major bottoms in the stock market. It is calculated as a 10-month weighted moving average of the sum of the 14-month rate of change and the 11-month rate of change for the index.
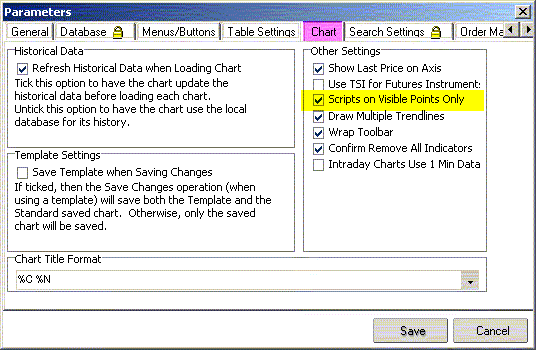
To save time, it is recommended to set the global chart parameters to "calculate visible points only". This means the script calculates and draws only for the days visible in the current window. (see "Parameters" below)
If you zoom out and wish to expand the plot, right-click inside the window, select the script's Properties, and click "OK". That will redraw the plot for the larger time frame.
Generally, plotted scripts work on any time scale.
However, the Coppock Indicator is commonly applied to MONTHLY charts only. However, some traders have found it very useful Intraday for certain types of Futures or commodities.
 Back to Catalogue Back to Catalogue
References:
Investopedia
IncredibleCharts: Coppock Indicator
Topline Charts: Interpretation
 Back to Catalogue Back to Catalogue
Parameters: MA
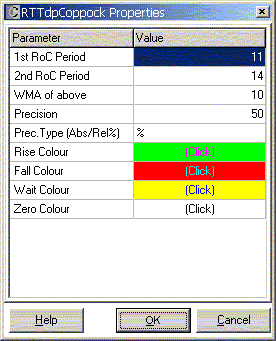
1st RoC Period = period, over which one Rate of Change is calculated
2nd RoC Period = period, over which the other Rate of Change is calculated
WMA of above = period, over which the Weighted MA of their sum is calculated
Precision = by how much does the line have to move to confirm the signal
Prec Type = Absolute (A) Precision is an absolute value, % or R indicates the value is a %-age
Rise Colour = colour of the line when a rise has been confirmed by a "Precision" move
Fall Colour = colour of the line when a fall has been confirmed by a "Precision" move
Wait Colour = colour of the line when a trend change has been detected, but not yet confirmed
Zero Colour = shows a flat line at 0, which is important to locate trend breaks

Global (File) Parameter Setting for Chart to draw plotted scripts faster:

 Back to Catalogue Back to Catalogue
Example
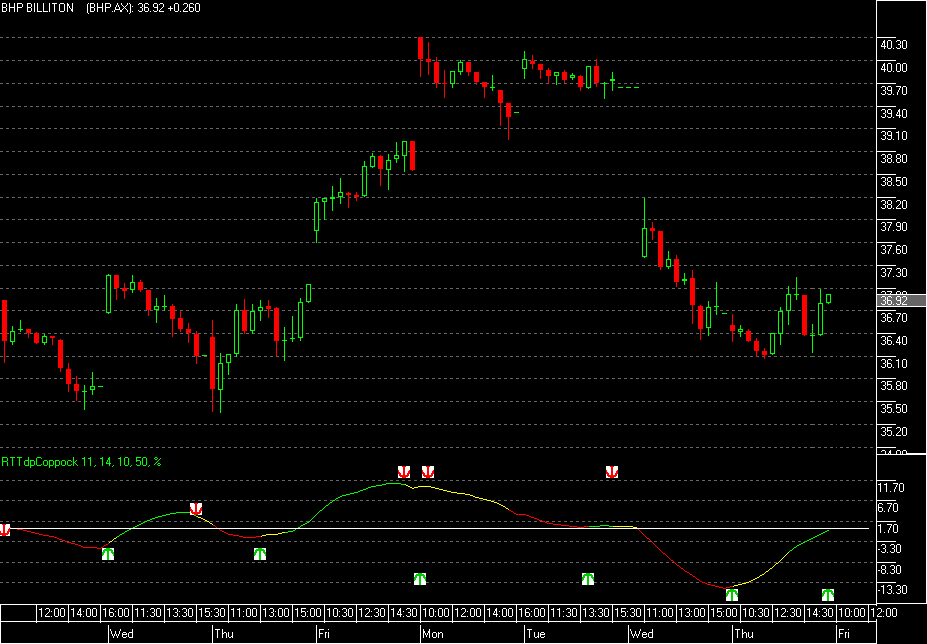
Directional Coppock Indicator, highlighting likely breaks of trend.

Directional Coppock Indicator, applied to a 30-minute Intraday chart.

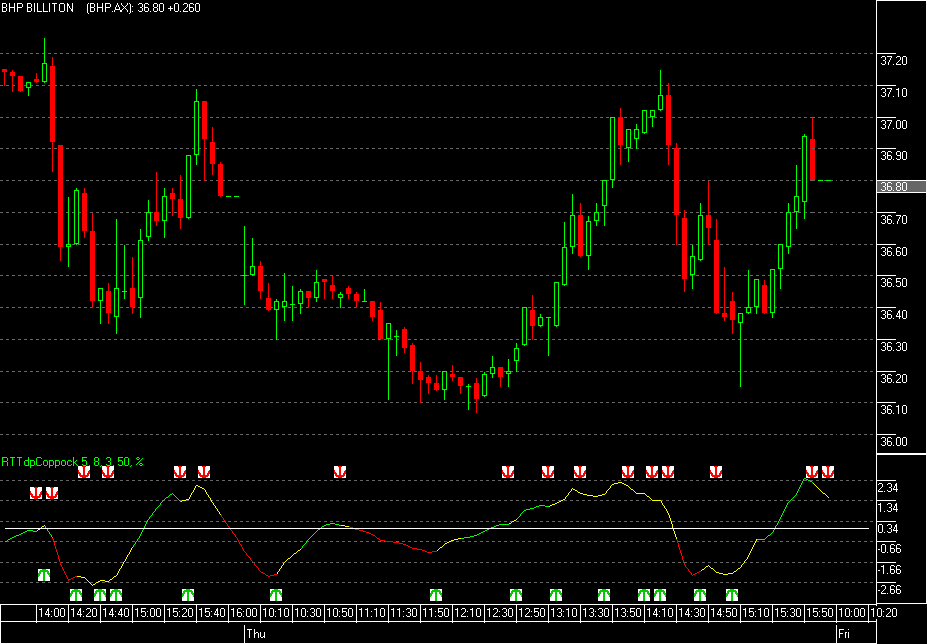
Directional Coppock Indicator, applied to a 5-minute Intraday chart.

|


