|
Script:
RTTcTrinityL
 Back to Catalogue Back to Catalogue
Purpose
:
Chart version of an Entry Script scanning for Long Trinity trades
enhanced version of hybrid script RTTc Trinity58Long
It draws four icons: Two Trinity icons -
 when the MACD speed has risen above average when the MACD speed has risen above average
 when the MACD speed has crossed above zero. when the MACD speed has crossed above zero.
and two auxiliary ones -
 where the Accumulation Pre-Alert is triggered, where the Accumulation Pre-Alert is triggered,
 when the price is rejected at a new resistance (count starts with each when the price is rejected at a new resistance (count starts with each  ) )
All other Trinity requirements must also be met: see "Trinity Approach" below.
Each icon is further differentiated by one of two colours: a pink background acts as a warning that volume has dropped off since the most recent Accumulation indicator. I have found this correlates quite often with a subsequent FTFF retracement.
The green background represents the "Classic" Trinity entry, with $Turnover on a similar level as at the latest A. (In the current script, 80% or above turns the colour green.)
The icons are drawn below the Signal candle; they are linked by a horizontal line at the most recent Signal level.
Please Note: "The Trend is your friend." is no idle cliche, but must be observed regardless of the indicators used in a Trading Plan.
Since Accumulation Indicators  and resistance levels and resistance levels  are drawn as they occur, it is unnecessary to have separate A(34...) indicators in the template; the are drawn as they occur, it is unnecessary to have separate A(34...) indicators in the template; the  will pick up the period and volume parameters as specified for TrinityL. The number of successive resistance levels will pick up the period and volume parameters as specified for TrinityL. The number of successive resistance levels  can also be specified (see below). can also be specified (see below).
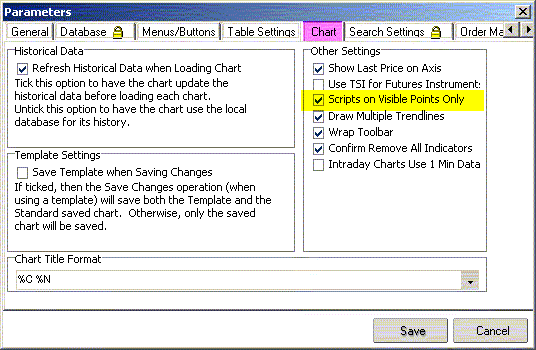
To save time, it is recommended to set the global chart parameters to "calculate visible points only". This means the script calculates and draws icons and lines only for the days visible in the current window. (see "Parameters" below)
If you zoom out and wish to expand the plot, right-click inside the window, select the script's Properties, and click "OK". That will redraw the plot for the larger time frame.
Please note that scripts work on any time scale. Substitute "tick" (week, hour, month...) for "day" where appropriate.
 Back to Catalogue Back to Catalogue
References:
Trinity Approach
MDS: Accumulation pre-alert
MDS: Technical Indicators Look specifically for MACD and Stochastic.
 Back to Catalogue Back to Catalogue
Application:
DNA: It is most important to find the parameters that can be shown to give best results for any particular stock. While the defaults have shown great results in general scans and trades, there is "always room for improvement". For example, one stock may tend to break out up to 30 days after the last A(34), whereas others may become unstable if it takes longer than a couple of weeks.
Trade Horizon: Measuring more than 50 trades coming out of one month's worth of alerted stocks, the average time in trade was close to 60 days. If you prefer shorter trades, you may wish to shorten the Accu period; if longer, try MACD periods more commonly used in general literature.
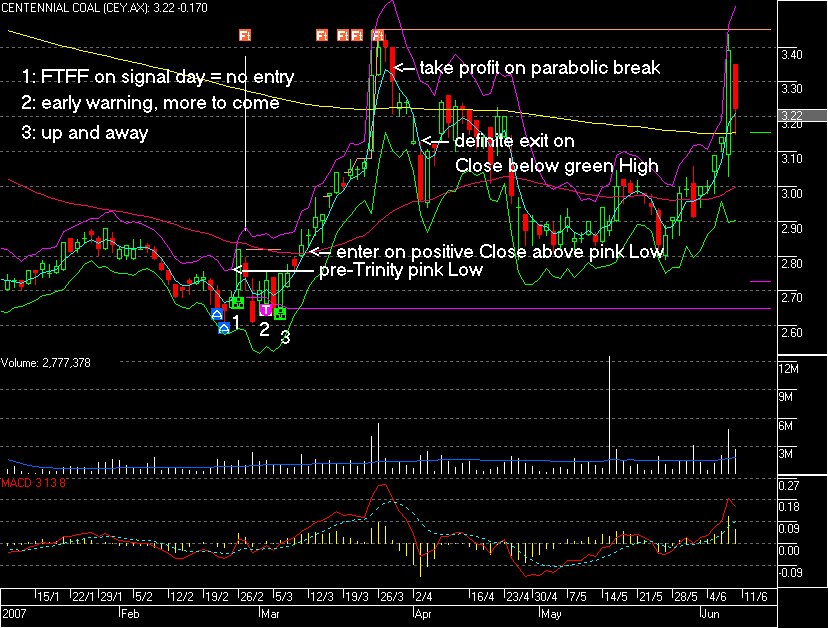
Entry and Exit: Taken on its own, a Trinity signal indicates a change in trend. As a rule, a next-day gap-up can usually be bought; where an FTFF looks likely, I tend to hold back. Since studying ATR Multiples, I have found that a single or 1.5 ATR above current price level (--> "DNA") can refine the entry process. Using the ATR Envelopes as an example, I try to get set as closely as possible to the last pink Low preceding the Signal day.
There are certain obvious exceptions: If the current price bands are still falling, it may be advisable to wait. See RTT ATR EnvelopesEx for details.
 Back to Catalogue Back to Catalogue
Parameters:
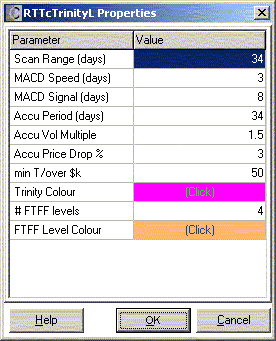
Scan Range = age limit of the most recent Accumulation Indicator
MACD Speed = fast period of MACD
MACD Signal = Signal period of MACD
Accu Period,
Vol Multiple,
Price Drop% = parameters for Accumulation Indicator 
min T/over $K = Ignore stocks with low daily turnover (in $'000)
# FTFF levels = draw resistance lines and mark drop days by 
colours for Trinity (Low) and FTFF resistance levels (High) can be independently specified.
Global (File) Parameter Setting for Chart to draw plotted scripts faster:
 Back to Catalogue Back to Catalogue
Example: Entry signals

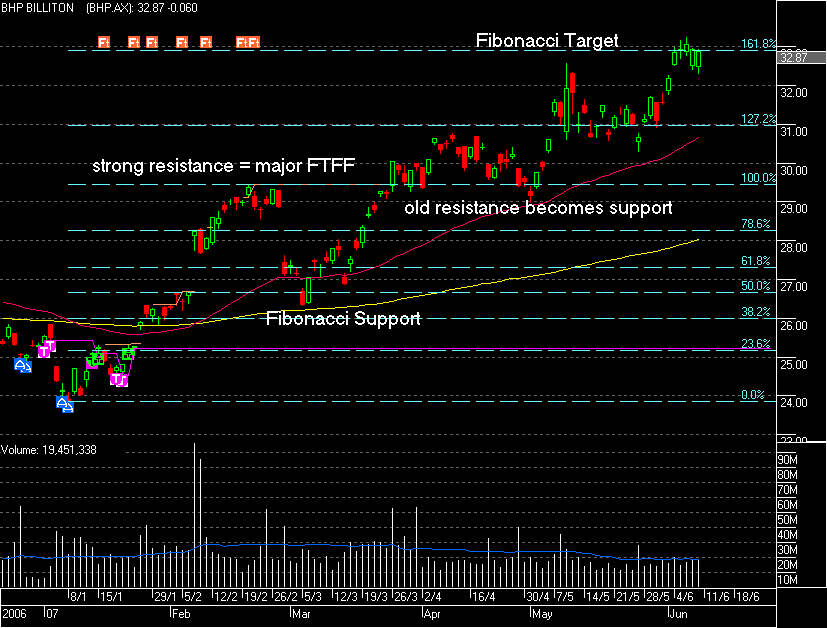
Example: minor and major resistance (FTFF) and Fibonacci Levels
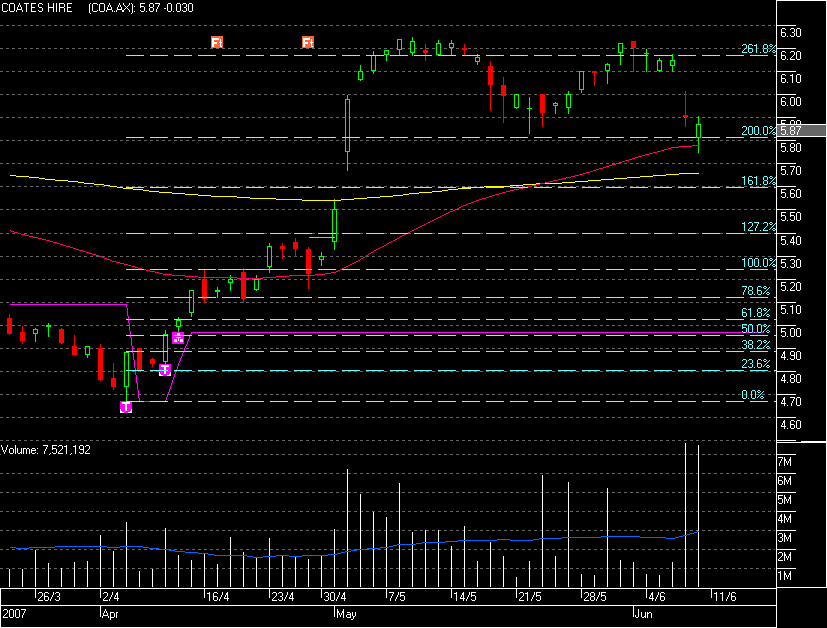
Example: pink colour, FTFF likely
Example: Entry and Exit by ATR Envelope
Back to Catalogue
|


