TTR
Consolidation Breakout Setup.
Caution: Bottom Picking is not only socially unacceptable, but highly speculative.
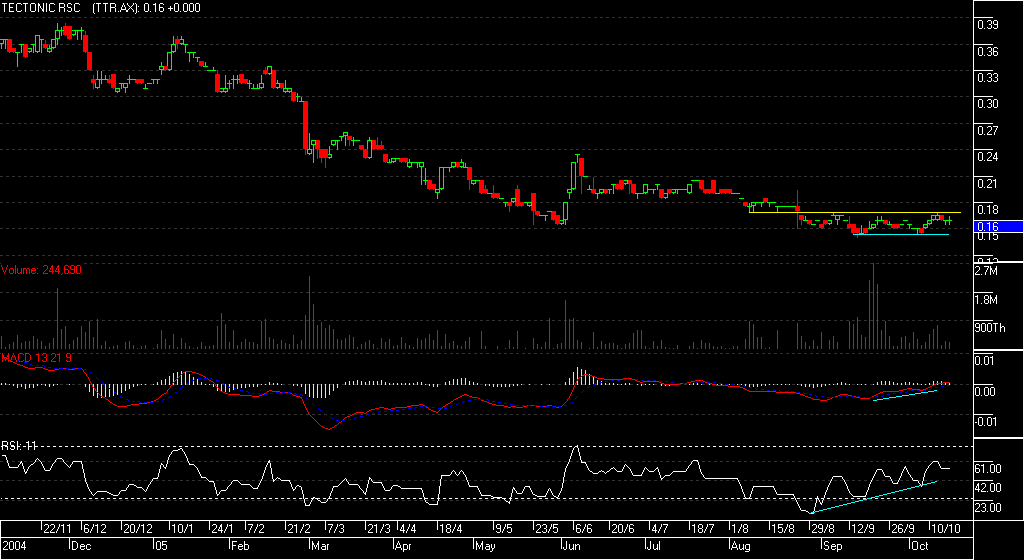
This little stock has enjoyed a nice volume injection last month, volume precedes price, suggesting something may be brewing.
Since then its been consolidating sideways with volume dropping off but still reasonable which indicates the sellers are drying up.
Nice Bullish divergence on RSI and MACD indicated by the light blue trendlines on the chart below, and MACD crossing zero.
I've grabbed a few @ 16c in anticipation, because the indicators tell me the break will more than likely happen - its just a question of when (there's never any guarantees though). I've also set an alert @ 17c and will top up if it looks like hitting 17.5c, which will be the breakout.
Disclaimer: The above mentioned information is my opinion
only, and NOT to be taken as advice as i am NOT a licensed
advisor. Caveat emptor.

Quick update 22/11/05: after drifting down once more, price has recovered and broken out of the channel today, with an excellent increase in volume. The company also announced today "PHILLIPS RIVER GOLD PROJECT RESOURCE UPGRADE"... So i've doubled up on the break as planned.
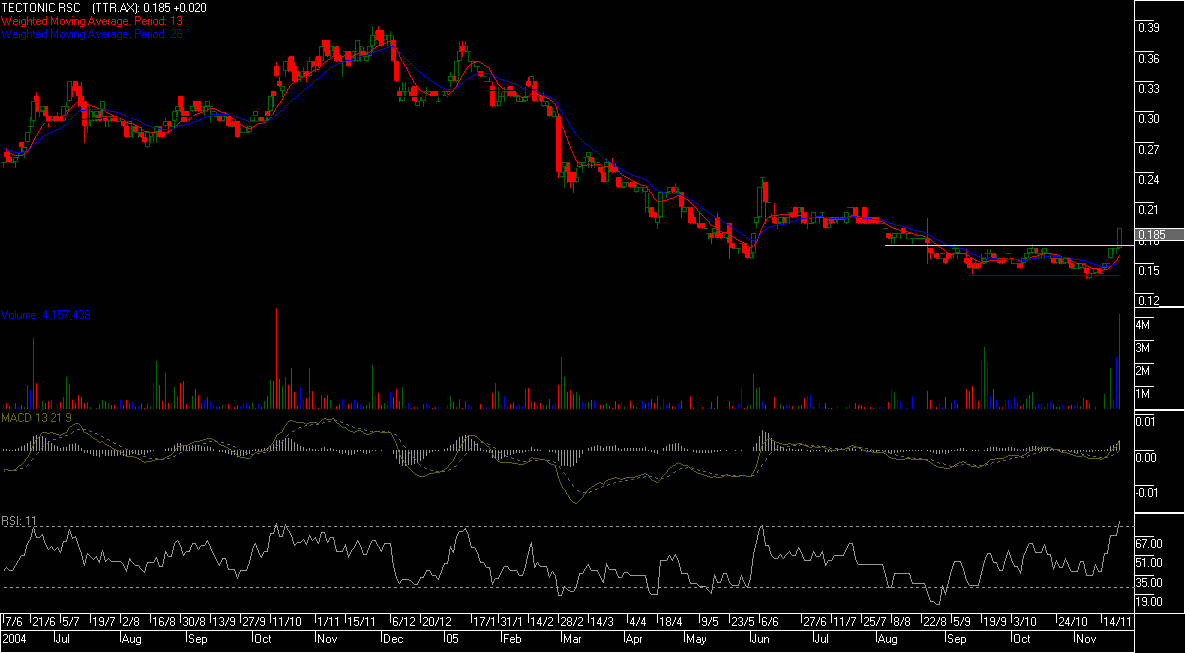
Update 11/1/05: Well, this trade is lagging a bit, but still profitable none the less. It was unfortunate to see price slip back inside the consolidation band after breaking out nicely at the time of my last update. An astute trader could have taken profits and bought back cheaper. Personally, i was prepared to hold while ever it held inside the consolidation band. Recently price has broken out once again, and once again with massive volume behind it. Weekly chart looking strong.........
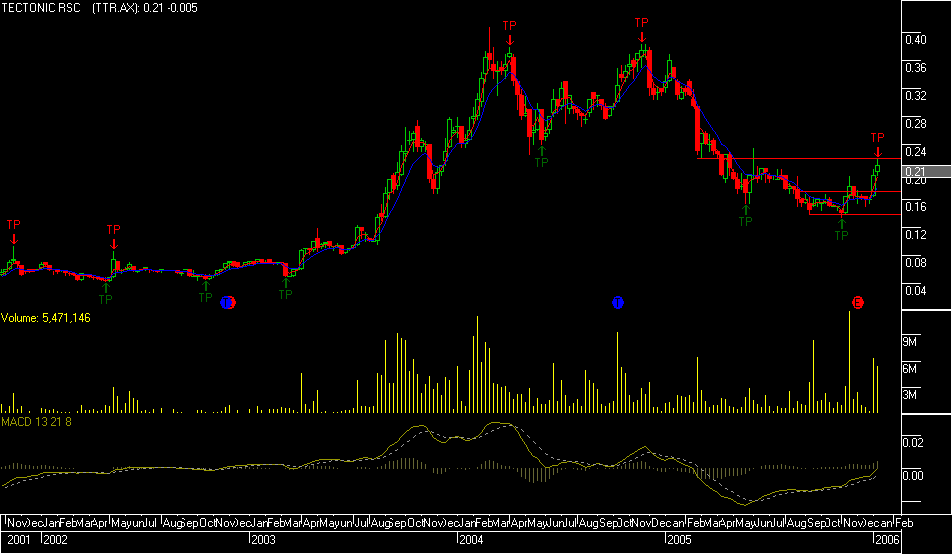
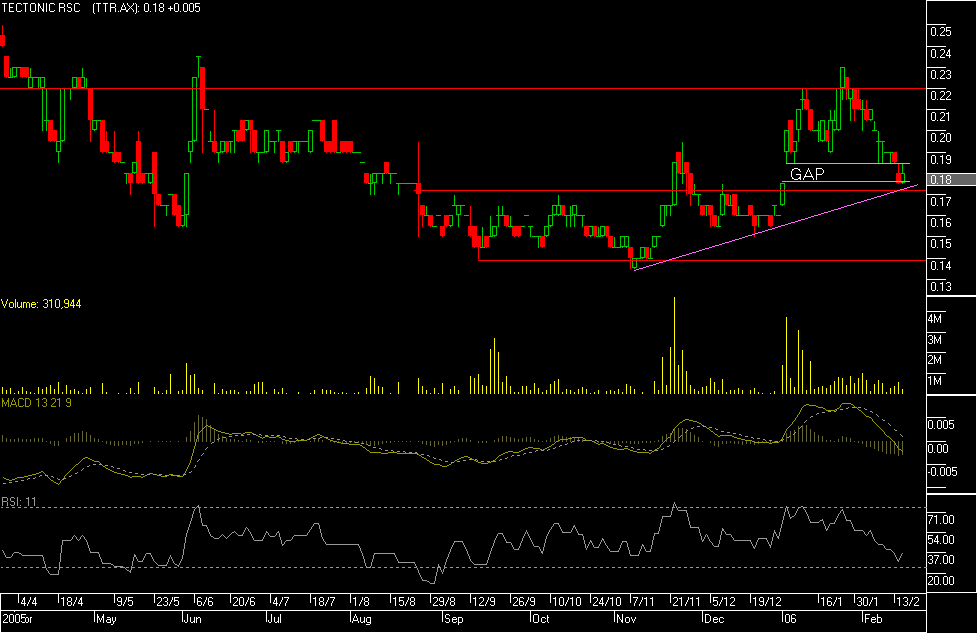
......On this occasion i've decided to sell half the position. This strategy is best used when you'd like to lock in some profits because you see price at a resistance level, but would not be suprised to see price move higher regardless. That's the case for me at the moment, the weekly chart is looking very nice and suggests much more upside to come yet. However, the daily chart looks like price has hit resistance, and a retracement could be on the cards. As price broke out of consolidation this time around, it left a gap. Gaps can be tricky, some say MOST gaps get filled - from my experience i've found that to be not entirely true. I've found that most NEWS related gaps get filled (depending on how substantial the news is) but most breakaway gaps don't. In my opinion this one looks like a breakaway gap, there's no news, and it's gaped out of consolidation. Therefore, price should find support at the top of the gap, rather than close it. I am hoping to buy my half position back at around 18.5c. If price continues higher without retracing, not to worry, i've still got some money invested ;-) Next targets i'm hoping for are 26c and 30c
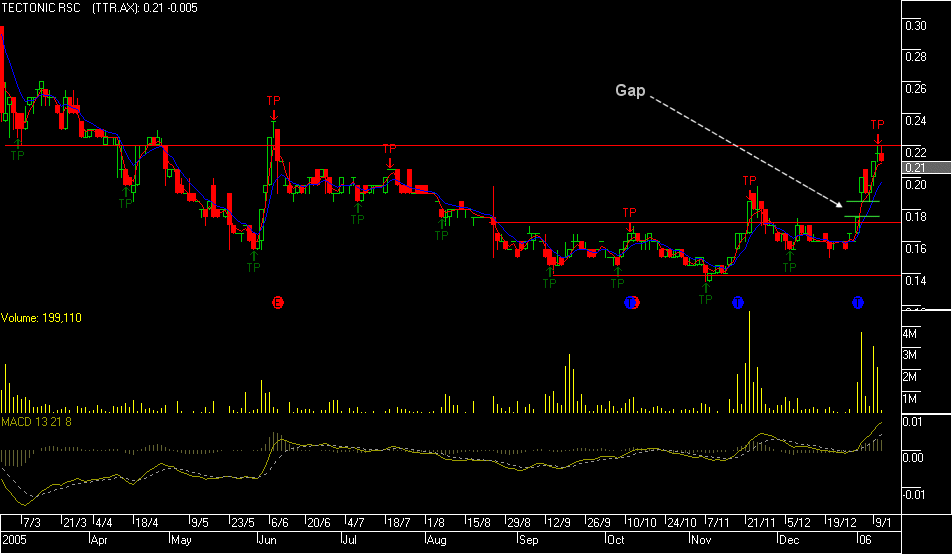
Update 15th Feb 2006: As you can see on the chart below, price did retrace from the resistance level mentioned above, and has filled the order@ 18.5c i had in the market to buy back the shares i had sold at resistance. Not entirely suprising to see that price actually completely closed the gap down to 17.5c, so a slightly better entry was achievable. The important thing here is we've locked in some profits at the higher level, and have bought back cheaper. Hopefully now price will resume its run higher after the pull back. The trend is still in tact, as shown by the pink trendline. Should price close below the gap, i will stop out still with some profits.
Disclaimer: The above mentioned information is my opinion
only, and NOT to be taken as advice as i am NOT a licensed
advisor. Caveat emptor.