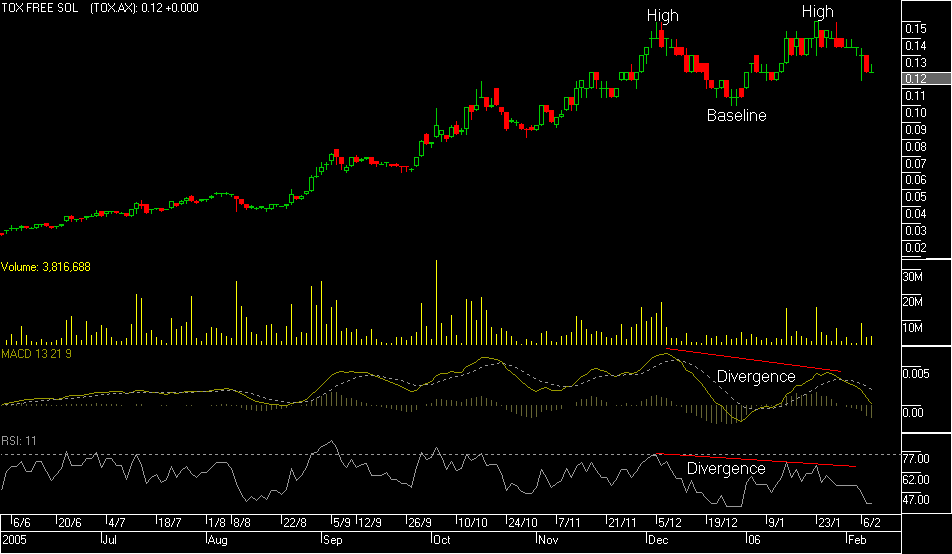
This is shaping up to potentially be a text book Double Top.
The highs in both December and January are both 15c, the baseline is 10c, if it breaks 10c, then that would be confirmation of a double top, if 10c holds, then it would be a double bottom in an uptrend - indeed a bullish sign. Also note the volume on the second high is less, this indicates not as many buyers - text book stuff in my opinion. By the look of other indicators (MACD especially) it does look as though a double top is a real possibility.
If the baseline is broken, that's the confirmation, then you take the range from the highs to the baseline and project it down, that gives you the eventual target....... do a google search for "double tops" and check various websites for confirmation of this pattern.
Here are some links to trading education sites versions of double tops......
http://www.incrediblecharts.com/technical/double_tops.htm
http://www.recognia.com/reference/patterndescr_dtops.htm
http://www.stockstoshop.com/doubleandtripletops.htm
Compare them with the chart below.
Disclaimer: The above mentioned information is my opinion only, and NOT to be taken as advice as i am NOT a licensed advisor. Caveat emptor.

Disclaimer: The above mentioned information is my opinion only, and NOT to be taken as advice as i am NOT a licensed advisor. Caveat emptor.