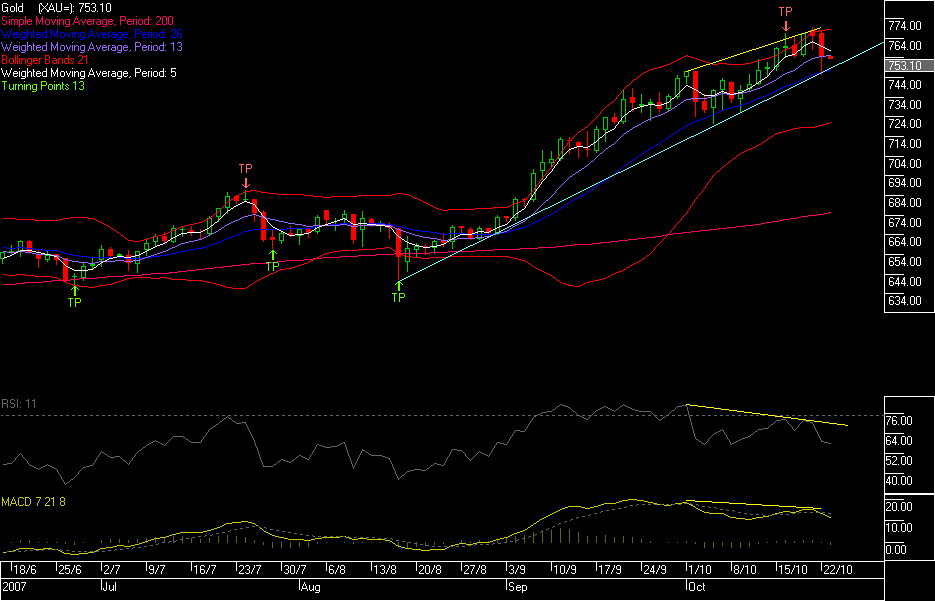
Gold Chart 22 october 2007
Notice the divergence on MACD and RSI (yellow trendlines, higher highs on price but lower highs on indicators)
If / when light blue trendline is broken, we'll see a retracement, or at least a sideways move. Can't see much more upside in gold at the moment.

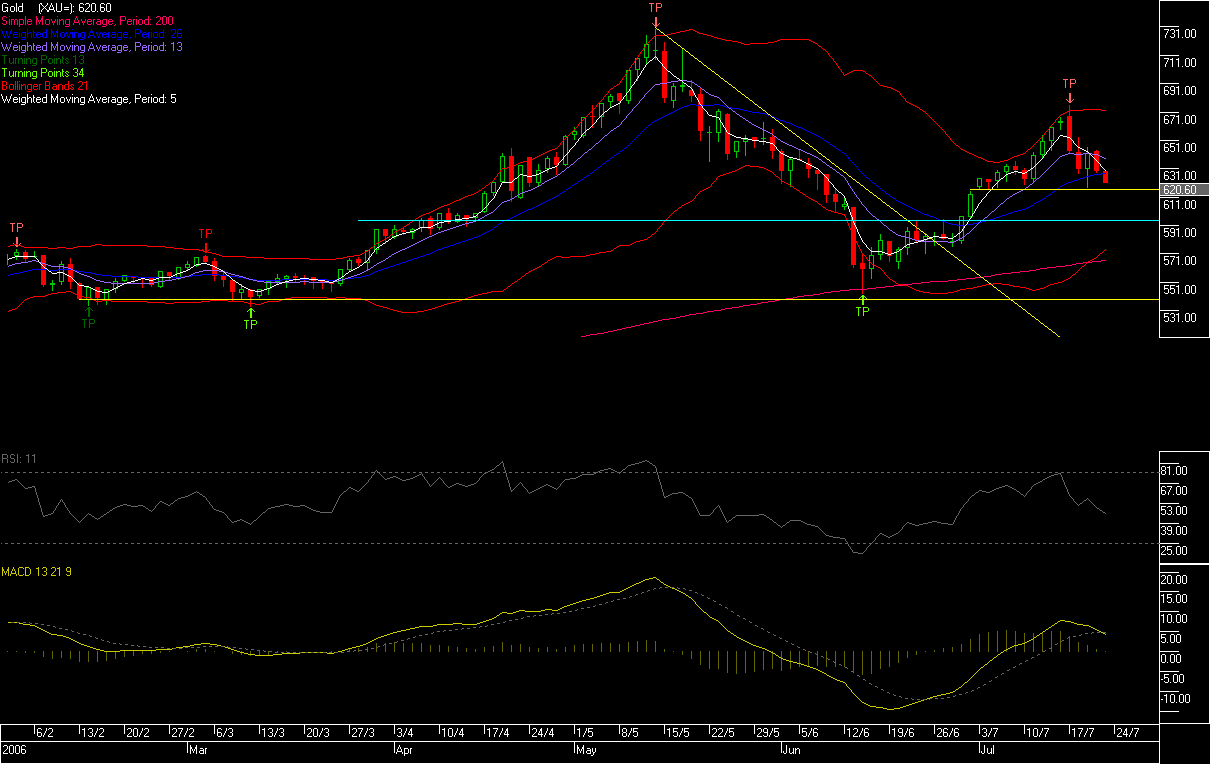
Gold chart 21st July

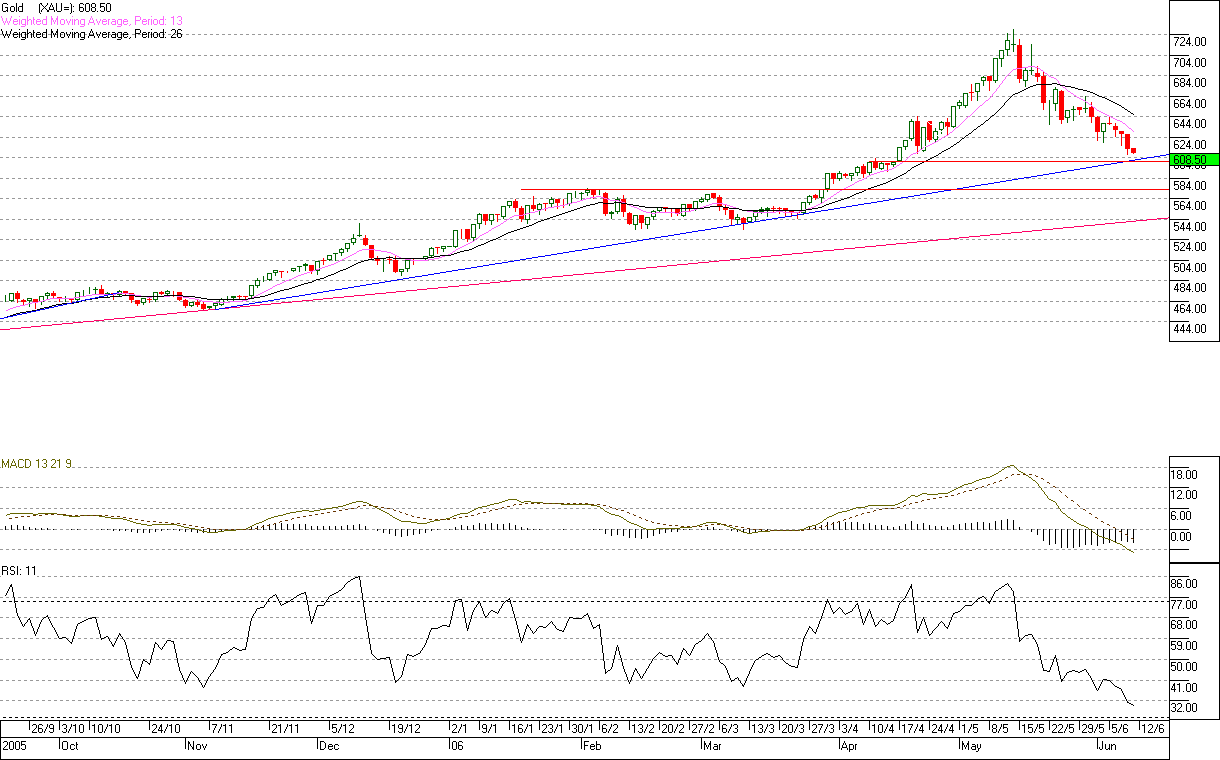
Gold Chart 9th June

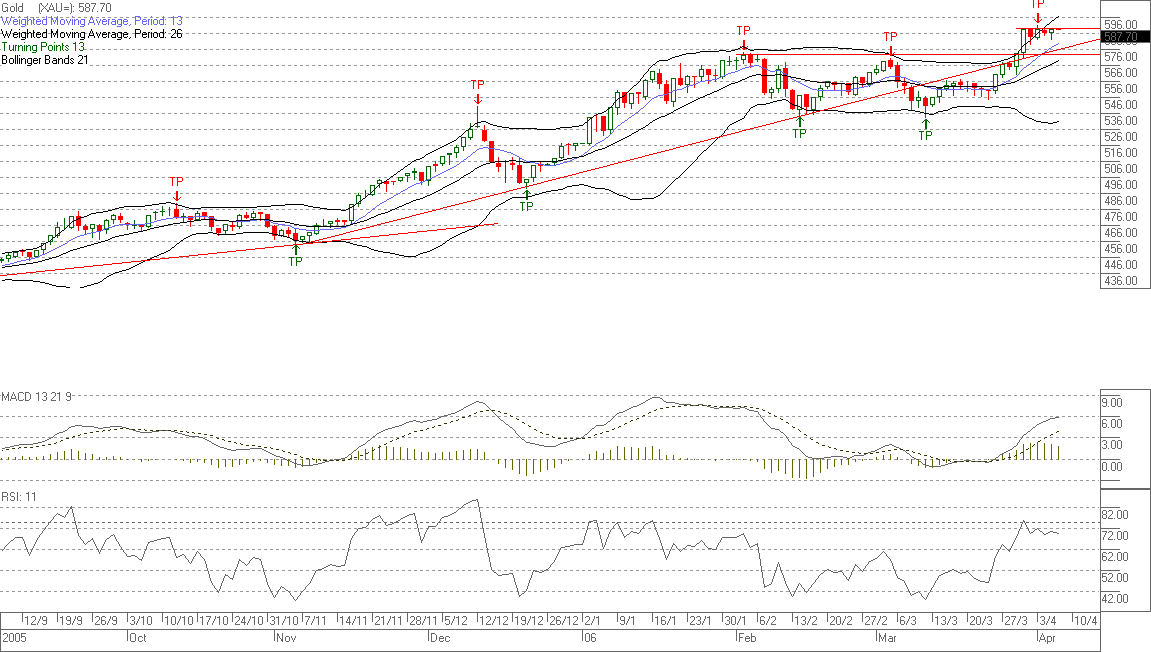
Gold chart - 6th April
