CQT - 22nd August 2006.
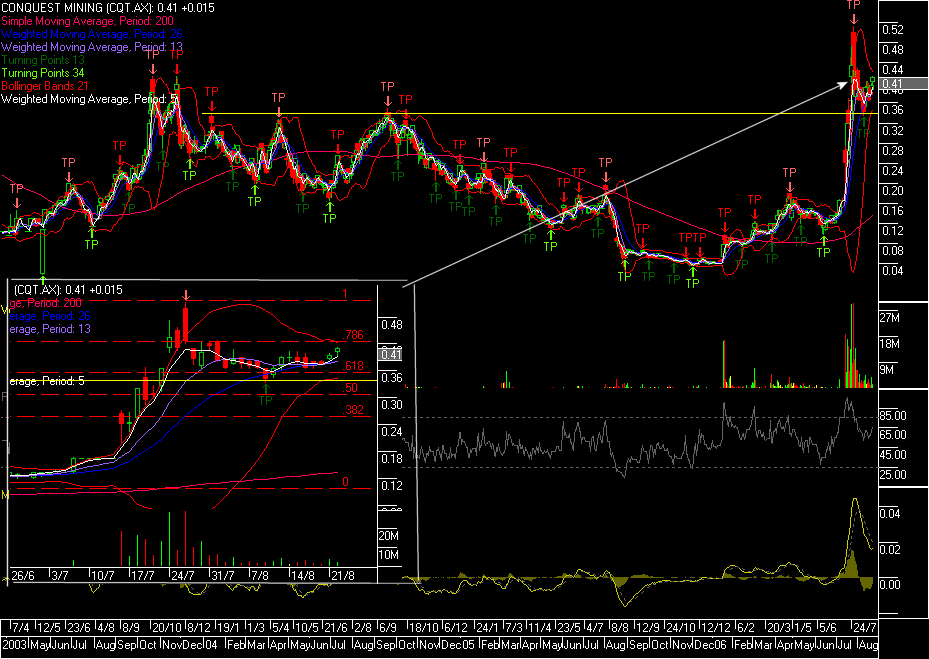
This one looks to be kind of a parabolic flagpole setup.
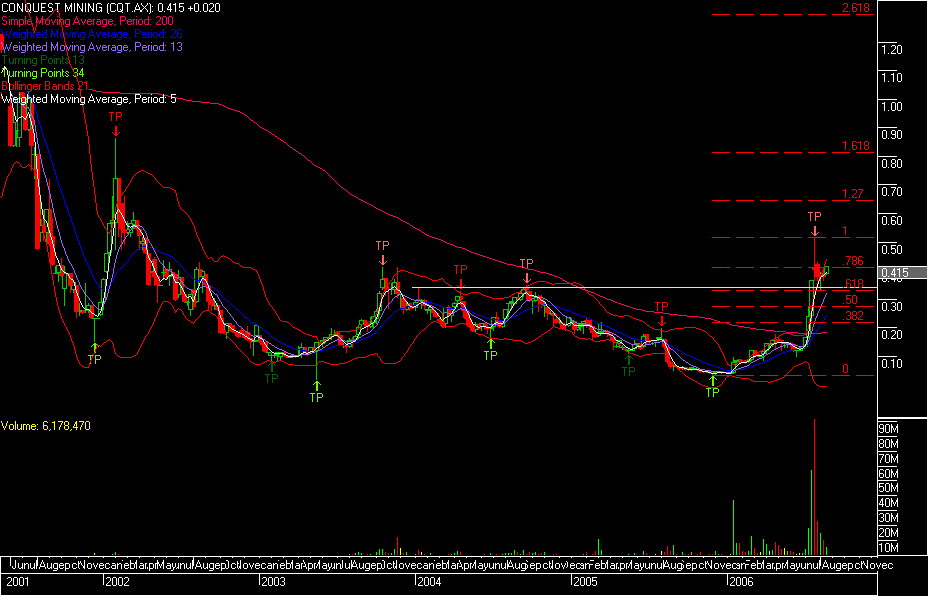
After the initial impulsive vertical move, price retraces, and consolidates within the upper 50% of the vertical range. A breakout of this consolidation range usually results in price moving to new highs. Targets can be set by placing a fibonacci tool on the range - as shown further down the page.
I've bought @ 41c, but lets lay out a CFD example:
Lets say I've bought 100,000 CFD's @ 41c. 100,000 x $0.41 = $41,000.
$41,000 x 15% for margin = $6,150 required. (don't forget to keep enough in your account free incase the trade moves against your entry a bit.)
So, for $6,150 you will have exposure to a trade that will move $1,000 for each cent gain/loss. Now consider how much gain in percentage terms could be made if this trade goes to plan and hits our 62.5c target ! That's right, potential for $21,500 (gross) on $6,150 .... roughly 370% !
Disclaimer: The above mentioned information is my opinion
only, and NOT to be taken as advice as i am NOT a licensed
advisor. Caveat emptor.
My time frame is "as long as it takes"
.
Using a weekly chart, i've placed a fibonacci retracement indicator over the range, you can see that the retracement was to the .618% level, which also happened to be a previous level of resistance (highs late 03 to mid 04) - old resistance becomes support. A break of 42c would confirm the flagpole breakout and first target could be around the 1.27% fib level - 62.5c.

Disclaimer: The above mentioned information is my opinion
only, and NOT to be taken as advice as i am NOT a licensed
advisor. Caveat emptor.
My time frame is "as long as it takes"